
Know which AI tools earn their seat.
The seats nobody opened, the spend beside each merged pull request, and a budget that stops the overrun this month. Claude Code, Codex, Cursor, Copilot and the API keys behind your agents, on one page.
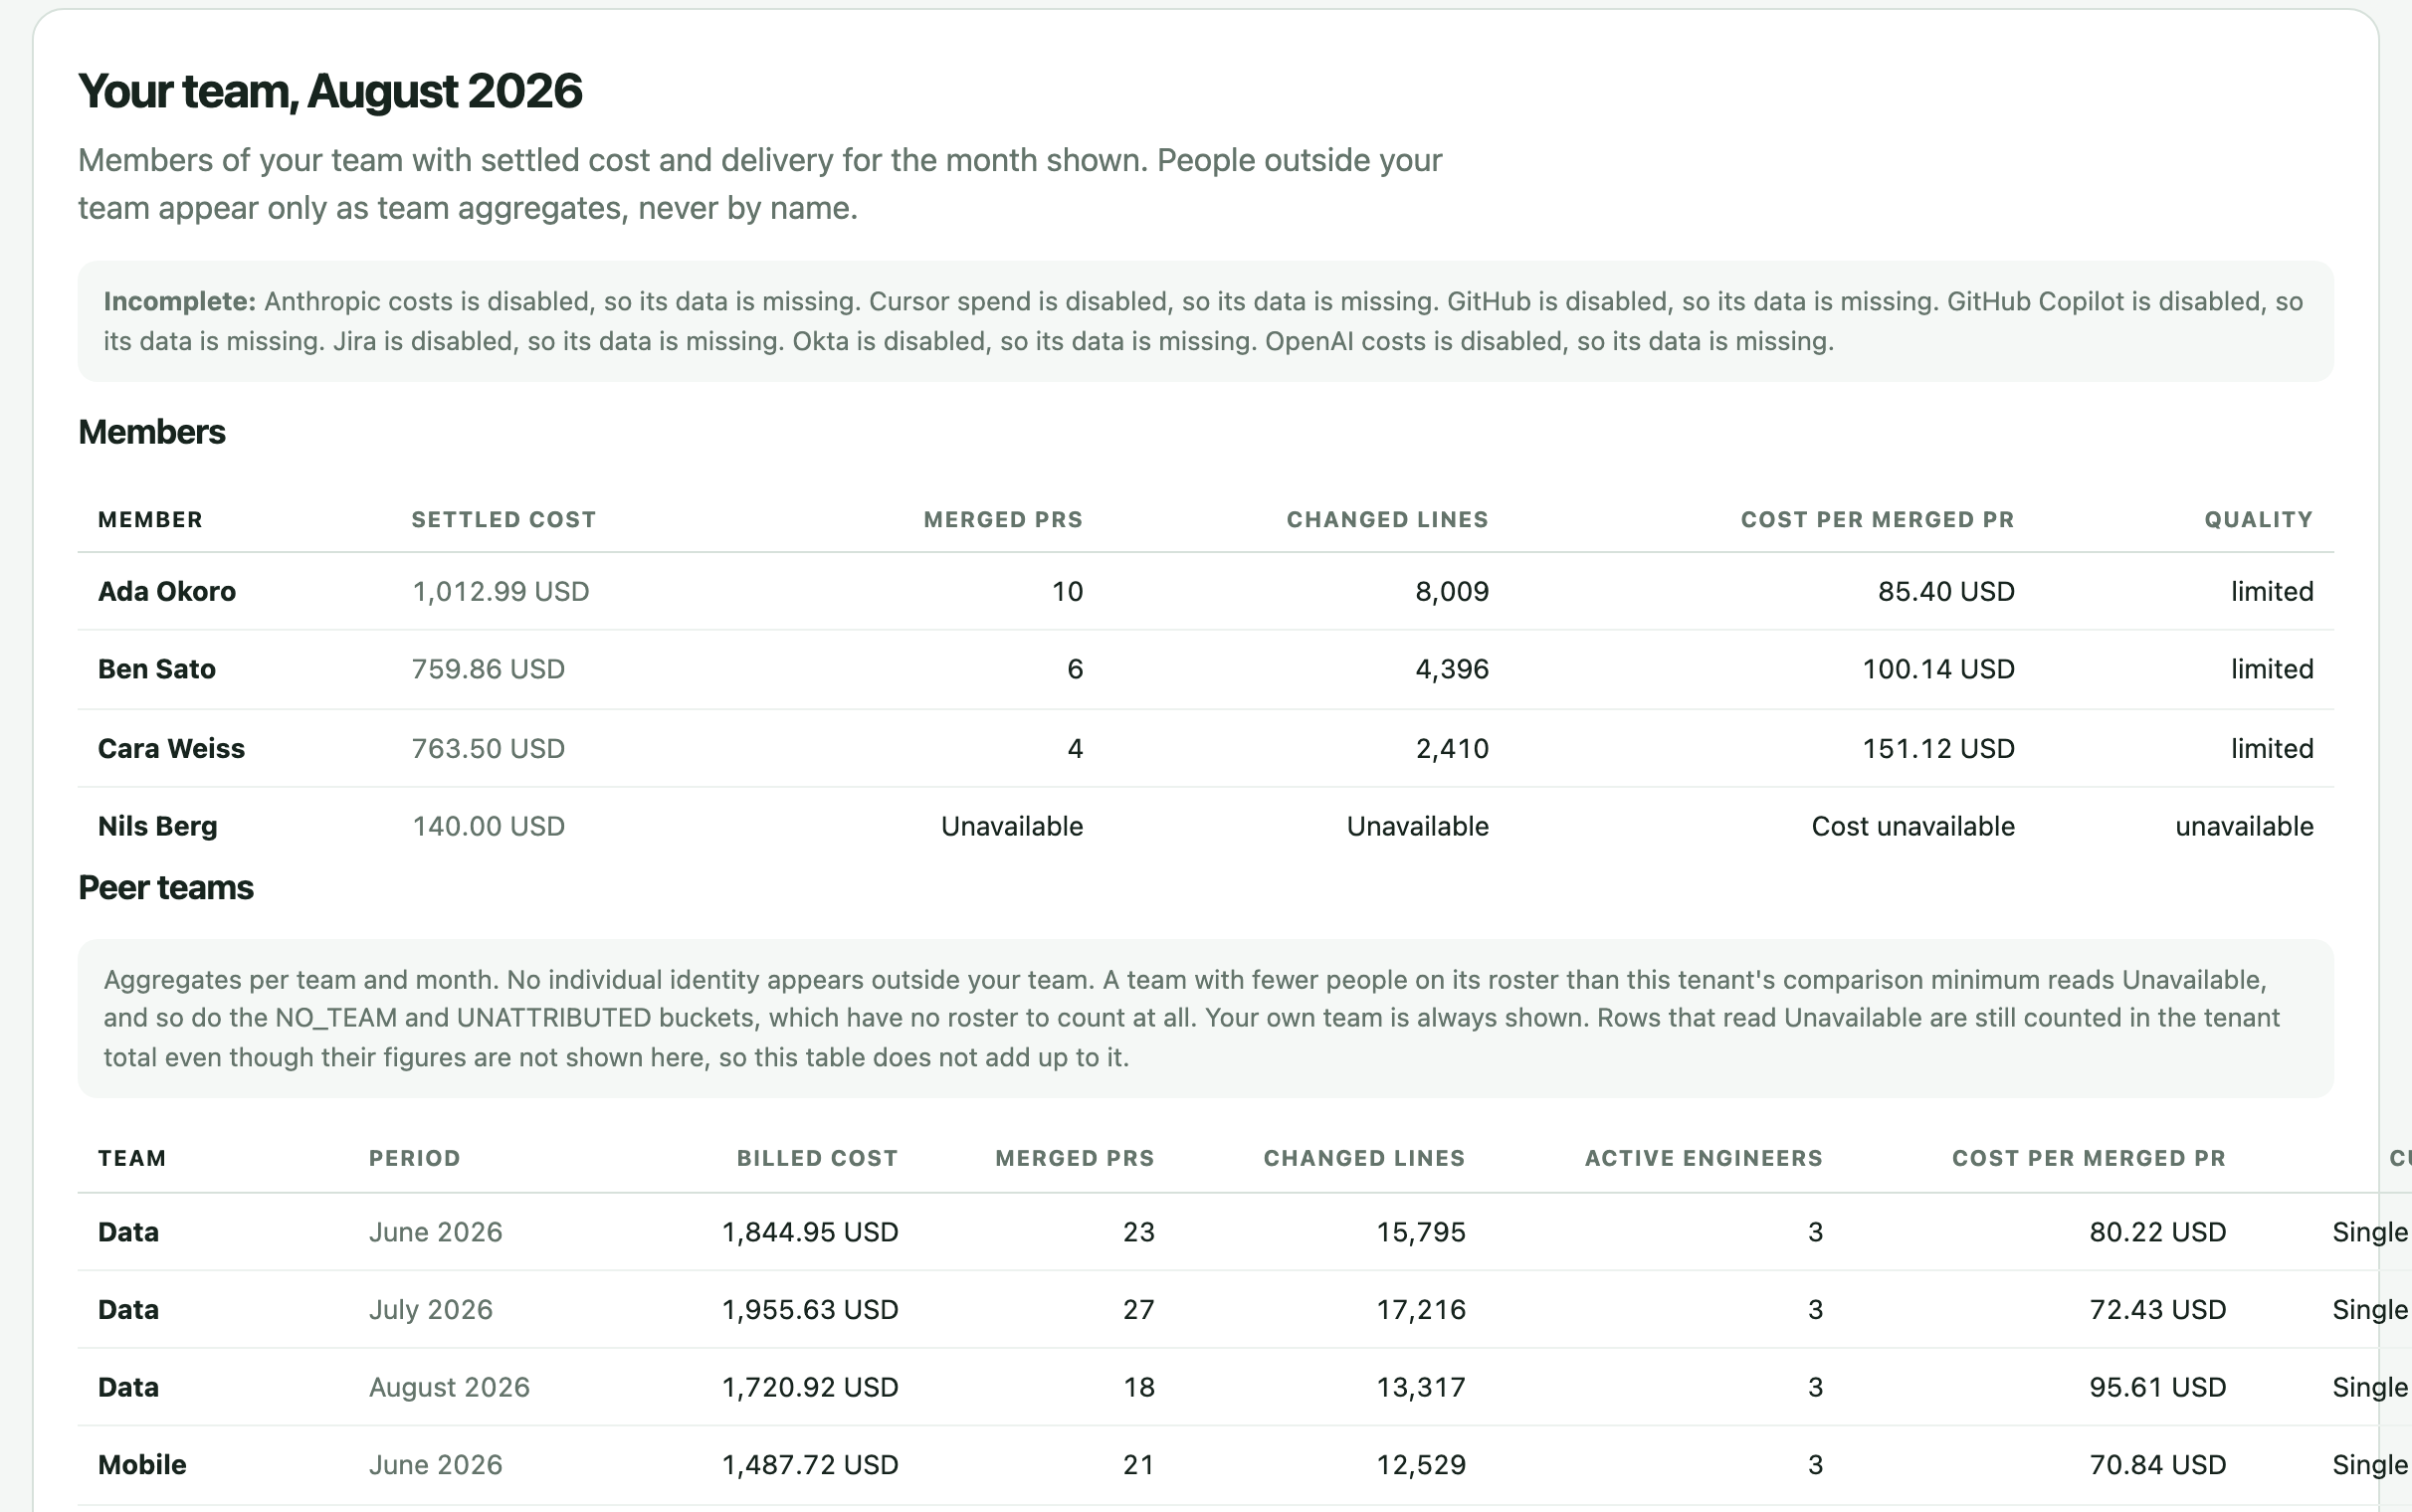
Four answers a lead cannot get from the vendors.
Each vendor shows you its own bill. None of them shows your people, your teams, or the work that merged while the meter ran. ai-cur reads all of them and joins the spend to that.
Who is using what
Every seat and every API key resolved to a person and a team, across Claude, OpenAI, Cursor and Copilot, in one month view.
What it cost, settled
Charges as they were actually bought: seat, usage, credit or commitment, held open until the vendor closes them, never added across currencies.
What merged beside it
Pull requests from GitHub and issues from Jira, joined to the same people in the same month, so spend sits next to output.
What to keep, cut or cap
Idle seats to drop, plans that no longer fit, and a budget with a cap your gateway enforces before the month gets away.
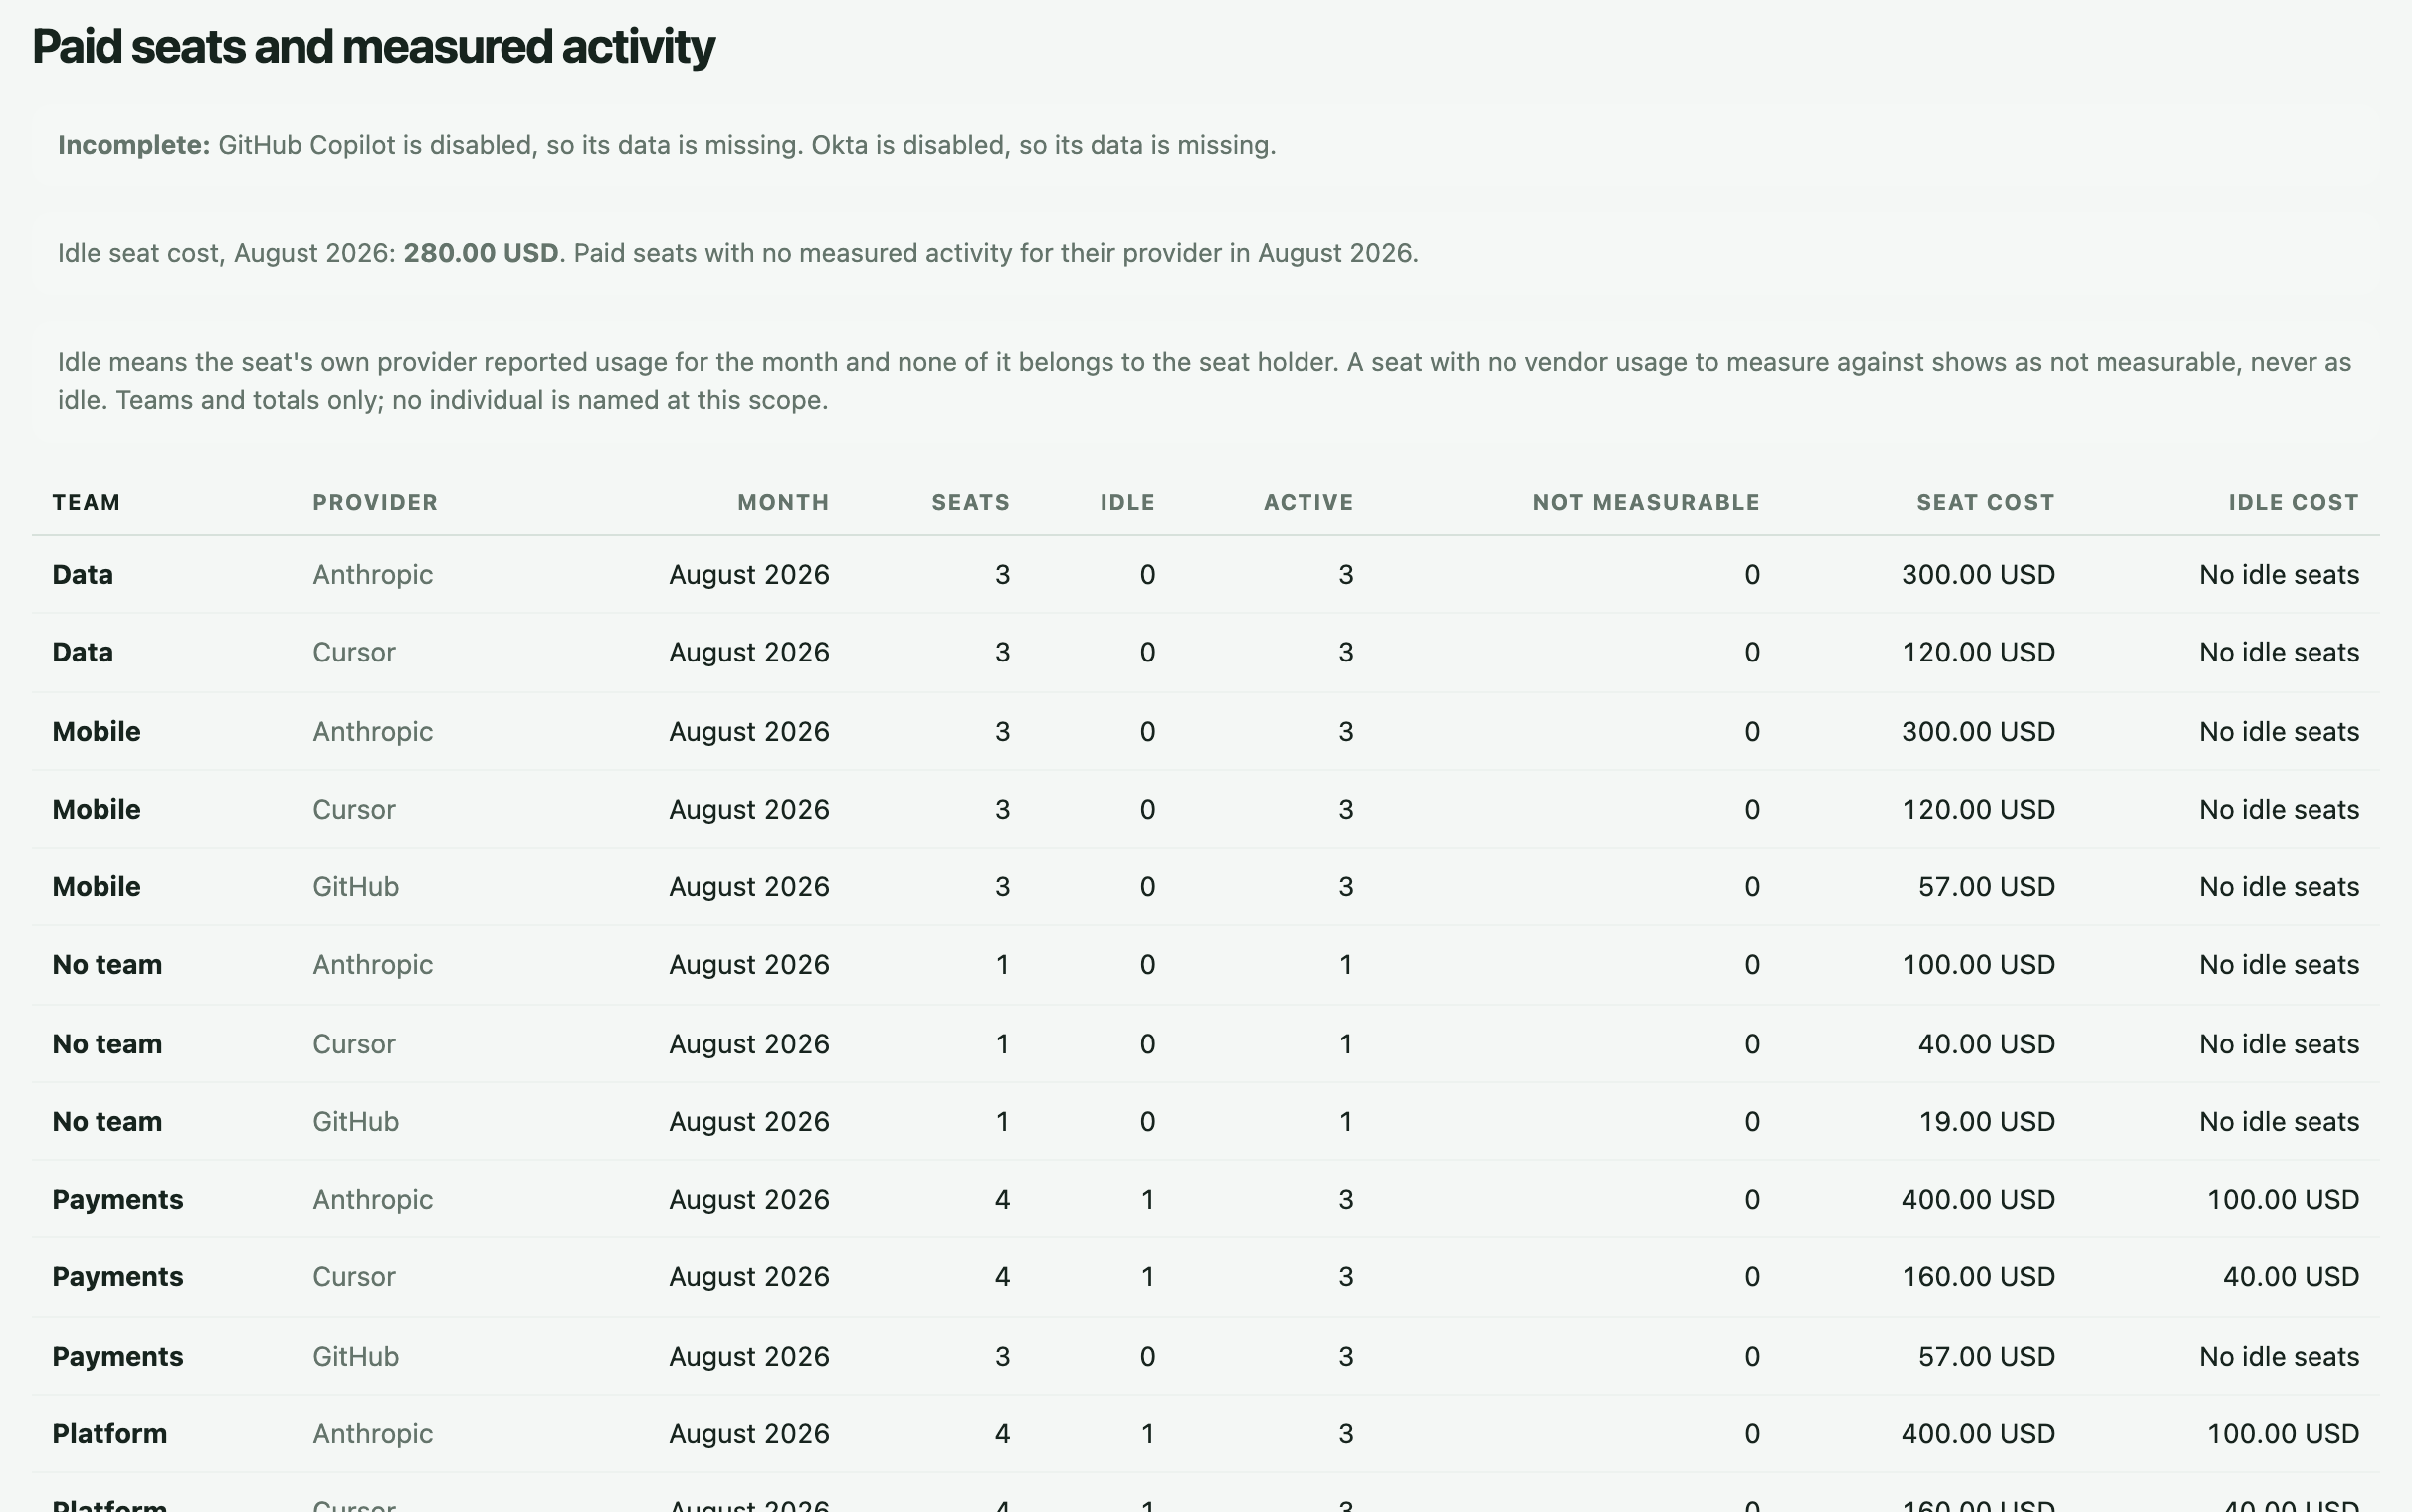
Find the seats nobody opened.
Every paid seat is checked against its own vendor's usage for the month and marked active, idle or not measurable. With no vendor usage to measure against, a seat reads not measurable, never idle.
In the demo tenant, two people left in July and kept their seats: August shows 280.00 USD of idle seats.
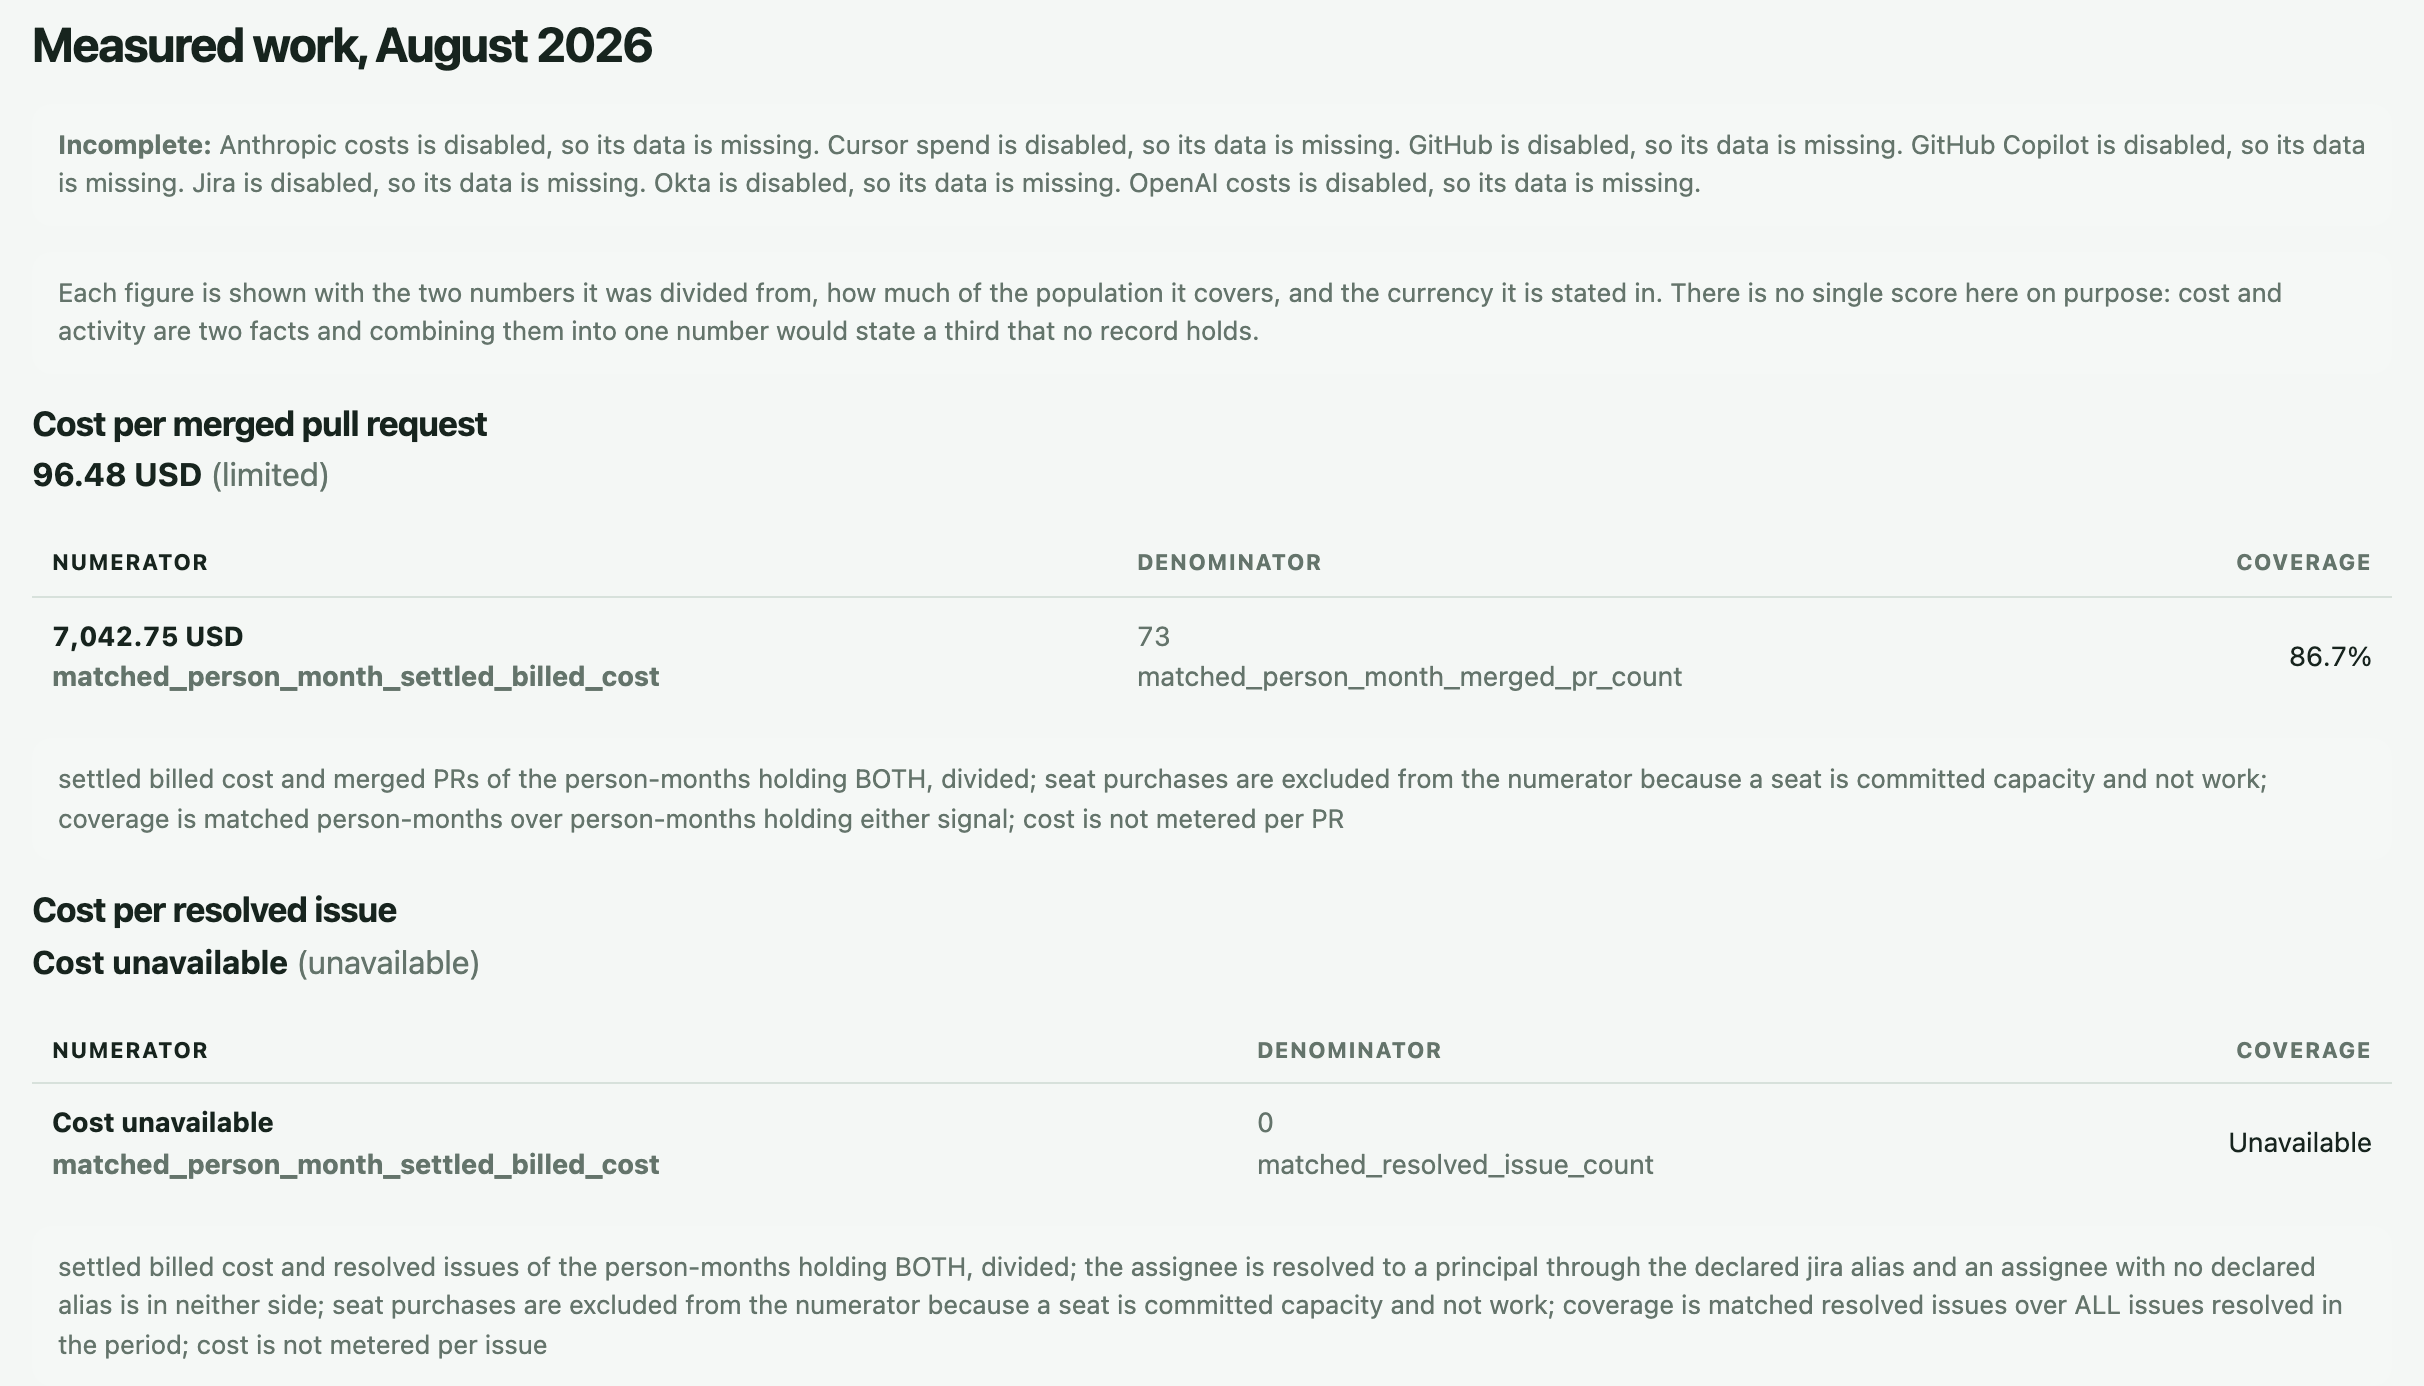
Put the spend next to what merged.
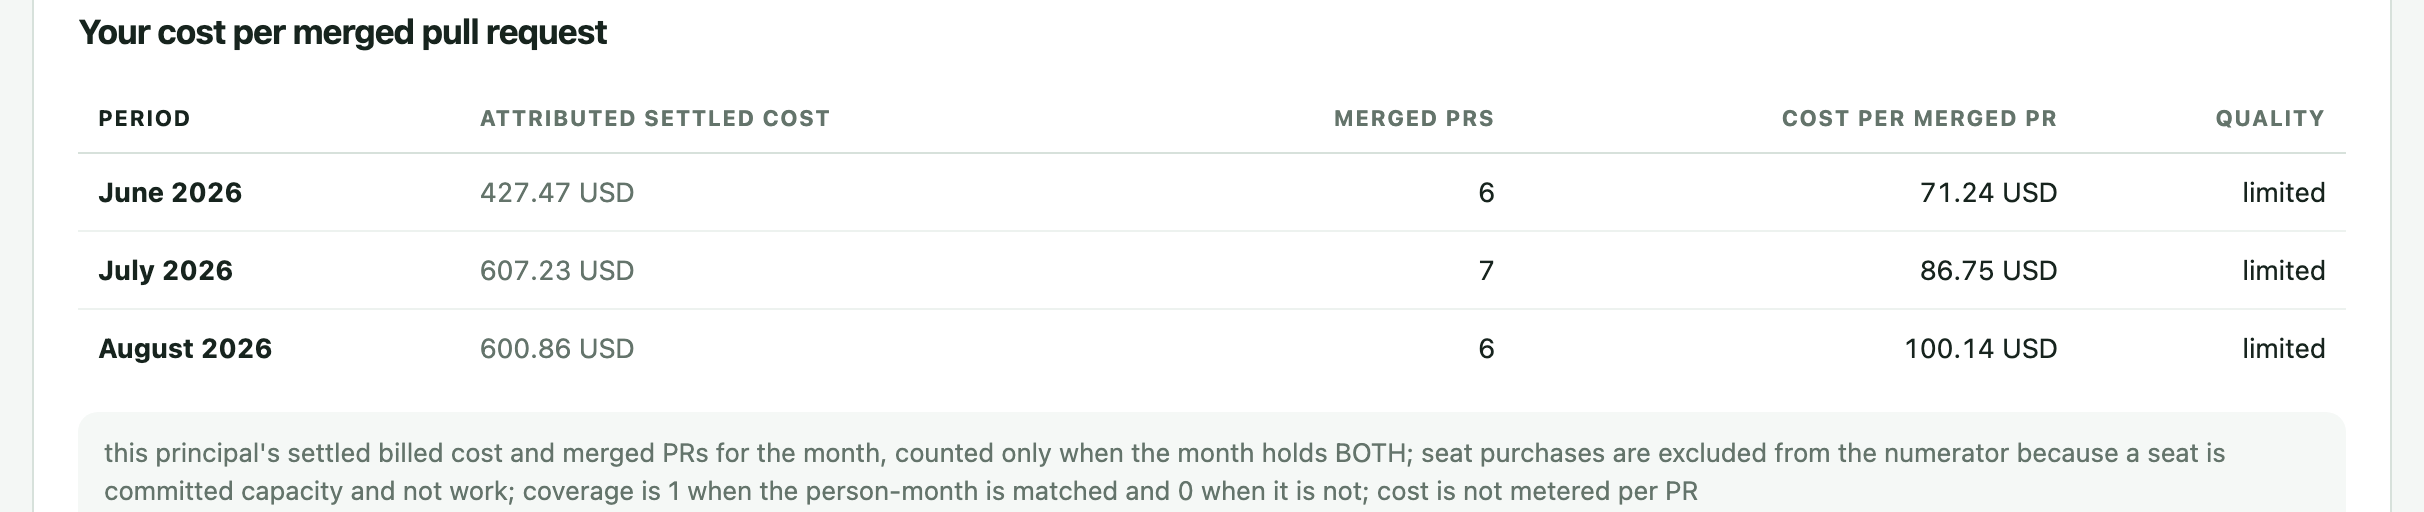
Cost per merged pull request for a person, a team or the company, printed with the cost and the count it came from. It puts the spend beside the output; whether the tool earned it is your call, made with the number in front of you.
A team smaller than your comparison minimum is not ranked against teams its manager does not run.
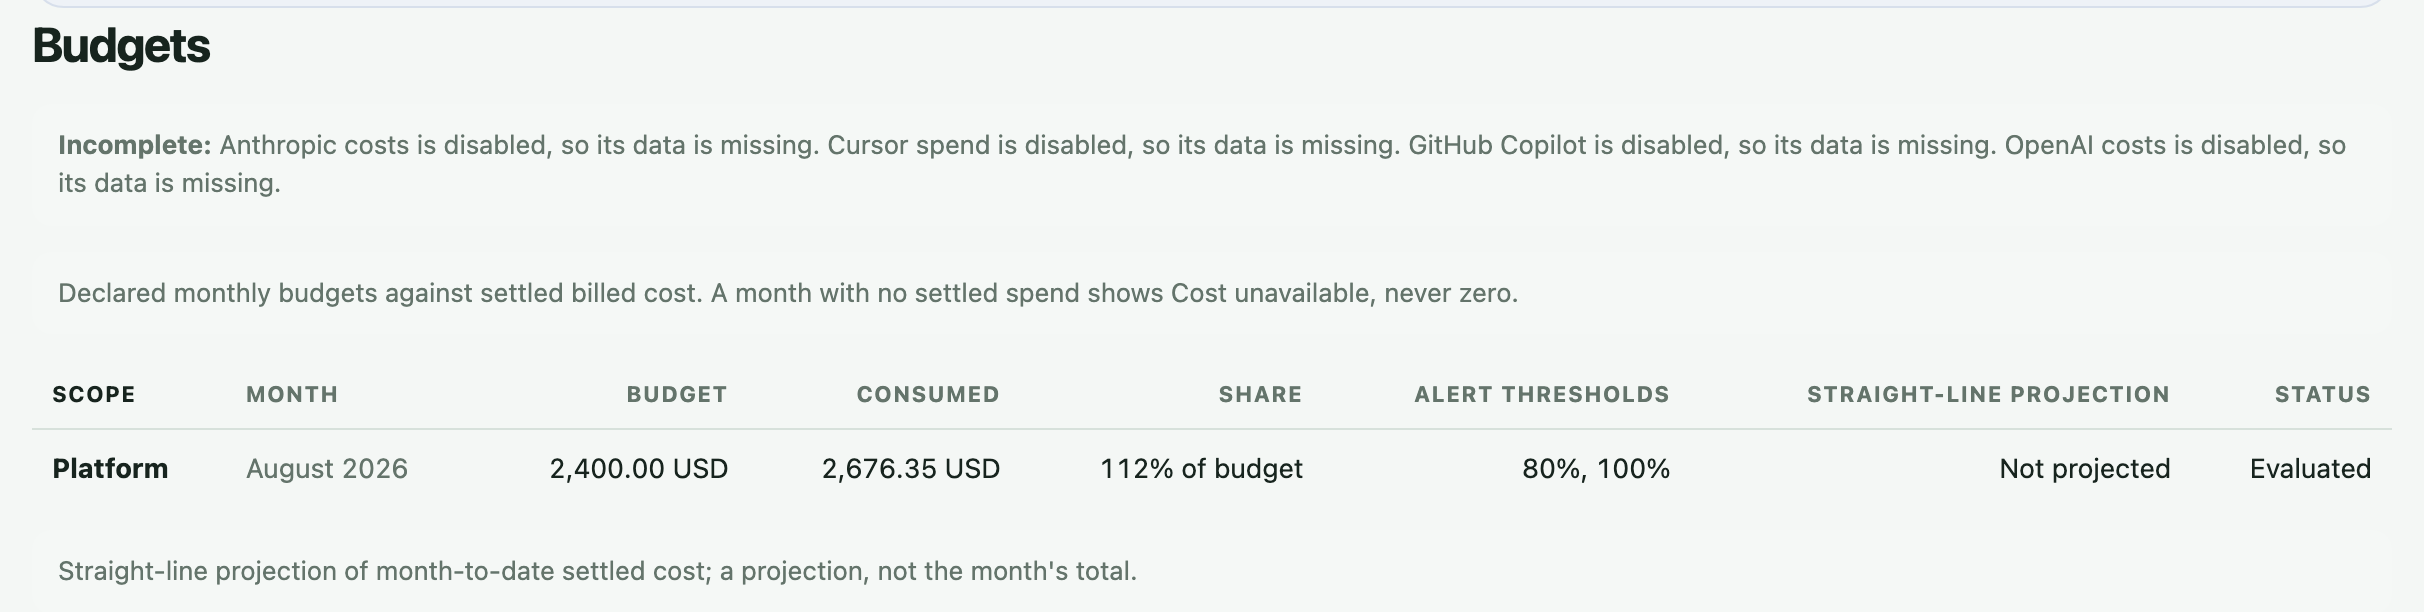
Catch the overrun while the month is open.
Give a team, a project or a person a monthly budget with alert thresholds, then add soft and hard caps. ai-cur publishes the decision for your gateway to read, and your gateway does the blocking.
In the demo, Platform has spent 2,676.35 USD against its 2,400.00 USD August budget, and the panel says so.
Start free, on your own Mac, today.
The AI Usage Tracker is open source and free for good. It sits in your menu bar, reads your Claude Code and Codex sessions where they already live on your machine, and can watch your Claude, Codex and Cursor plan limits.
No account and no card. When the team wants a shared view, each install is enrolled with its own revocable token, and its figures join the team's page.
Hand finance a file, not a debate.
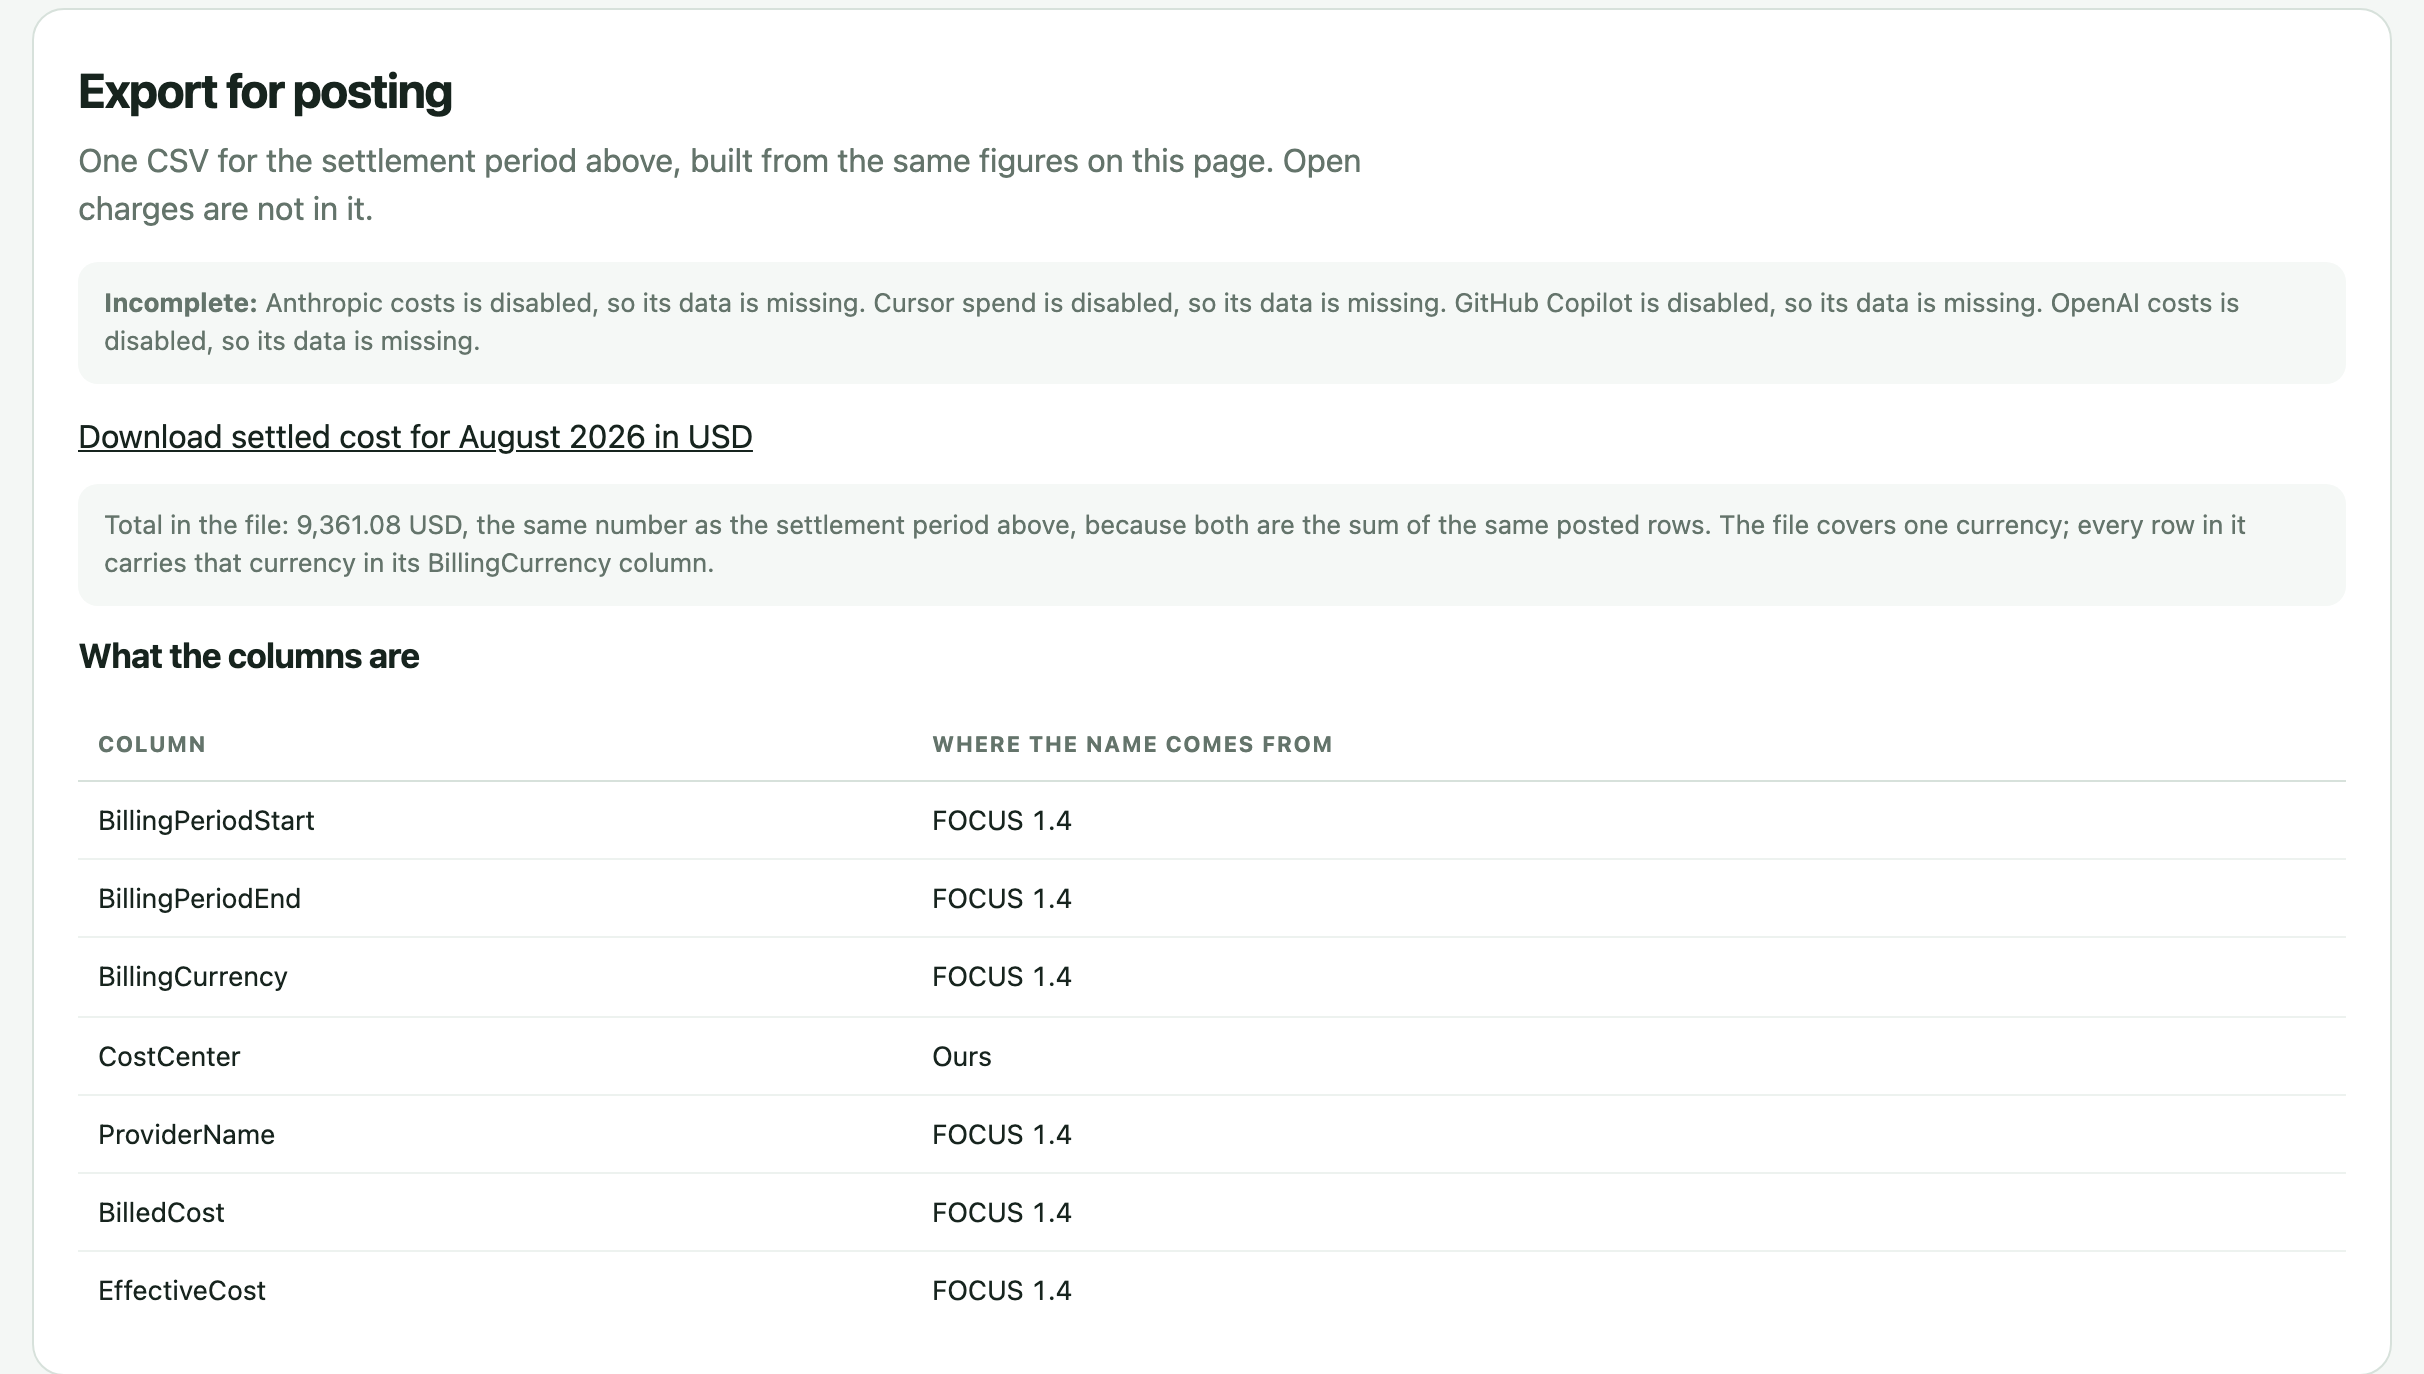
The finance view closes a month by cost centre and provider, holds unsettled charges back, and exports a CSV whose total is the page's total.
In the demo, the August file comes to 9,361.08 USD, the figure on the page above it.
And the rest of what it answers.
Each one has its own section, with the screen that answers it, on the product page.
Usage with no seat on record
People using a tool you buy seats for, where no seat for them appears in the billing.
Plan fit
A seat's price beside the same usage at the list price your admin declares.
Contracts and commitments
What each charge was bought under, and how a declared commitment is drawing down.
One currency per total
Two currencies are never added together, anywhere in the product.
Corrections you can trace
A fix is its own row beside the original, which stays visible.
Every source's state
Disabled, denied, failed or stale, shown on the page instead of a quiet zero.
Projects and issues
Settled cost split across the projects people closed issues in.
Roles and invites
Engineers see themselves, leads see their team, leadership sees aggregates.
Your data, yours to take
Export your records, or delete your account with time to change your mind.
Three ways to start.
Free
The whole Tracker for one engineer, and the hosted view of your own reports. Team totals appear as teammates install.
Team
For the lead who answers for the spend: idle seats, plan fit, budgets, caps, alerts and exports, with a trial and no card.
Business
For larger estates: your own identity provider, declared contracts and commitments, and the Databricks, ServiceNow or on-prem profile.
Start on your own numbers. Bring the team when it is ready.
Sign up with a work email, Google or Microsoft. The Tracker and your own view cost nothing, and a team gets sixty days of Team before anyone is asked for a card.
One question to bring: what does your company spend on AI tools per employee each month? The answer says whether seats or budgets deserve the first look.