
For whoever has to say what the AI spend returned.
Every function is buying AI, and the leaders who approved it are now asked what came back. ai-cur gives each of them the same record from their own side.
One page for the whole AI portfolio.
You approved AI across the company, and the board asks what it returned. See every function, team and tool with its spend, its output and its trend, and move money toward what works.
- Spend and output by function, team and tool
- Before and after each adoption
- The best and worst return per unit of spend
- Capacity nobody is using, in money
| Function | AI spend | Cost per item | Trend |
|---|---|---|---|
| Engineering | $31,400 | $24.45 | −12% |
| IT and operations | $7,900 | $4.91 | −6% |
| Sales | $5,300 | $12.86 | +3% |
| Support | $3,610 | $5.68 | −9% |
Illustrative data only. Cost per item is shown by function, never blended across them.
Coding assistants and agents, beside what shipped.
The function with the richest work record, and where ai-cur goes deepest today.
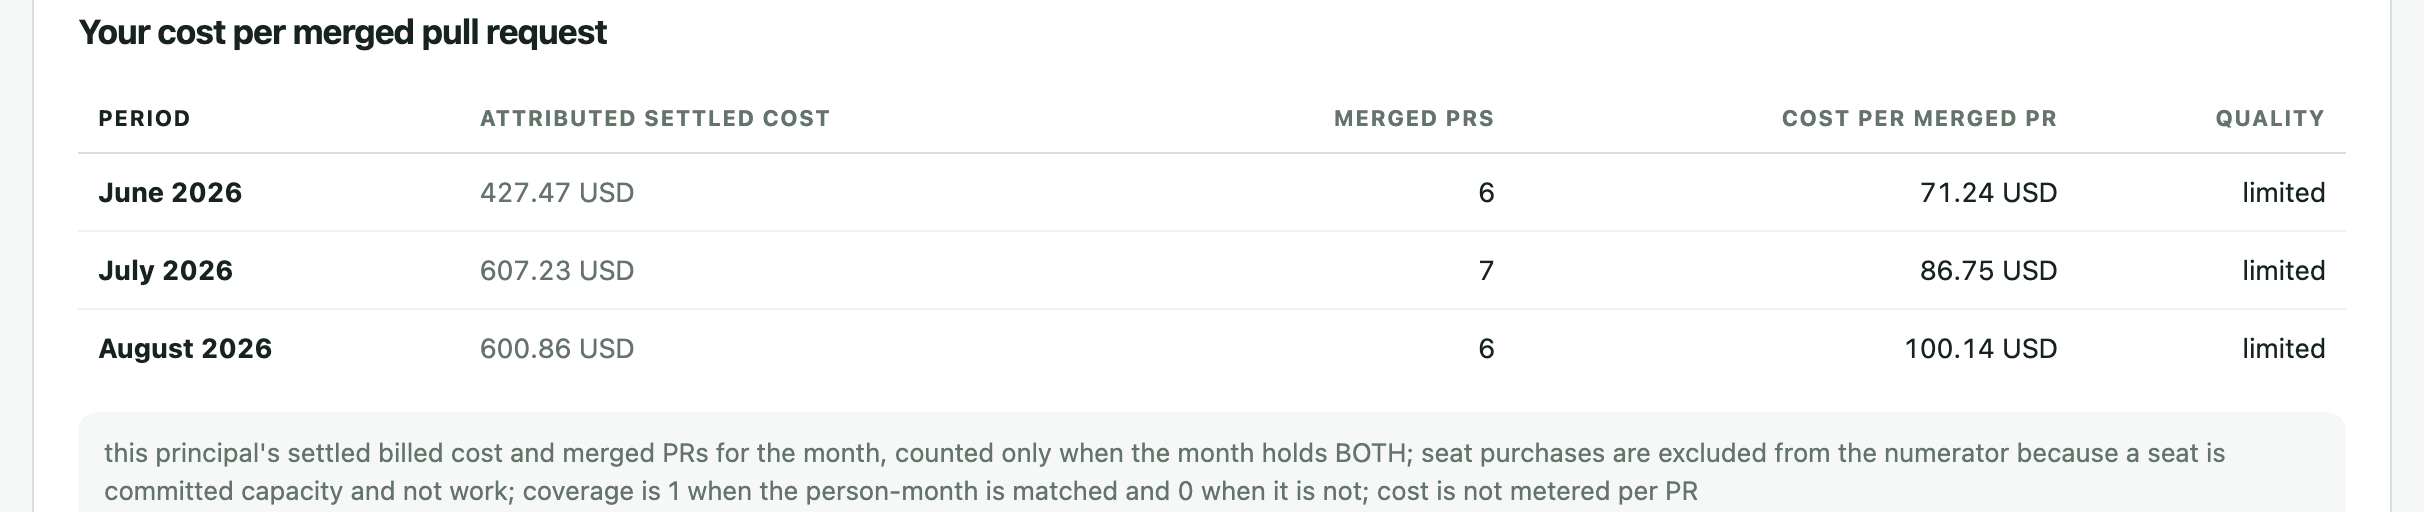
- Cost per merged pull request, issue and epic, with both sides of the division shown
- Idle seats, seats nobody recorded, and plan fit
- Project and person budgets with caps your gateway enforces
- Teams compared only above a minimum size
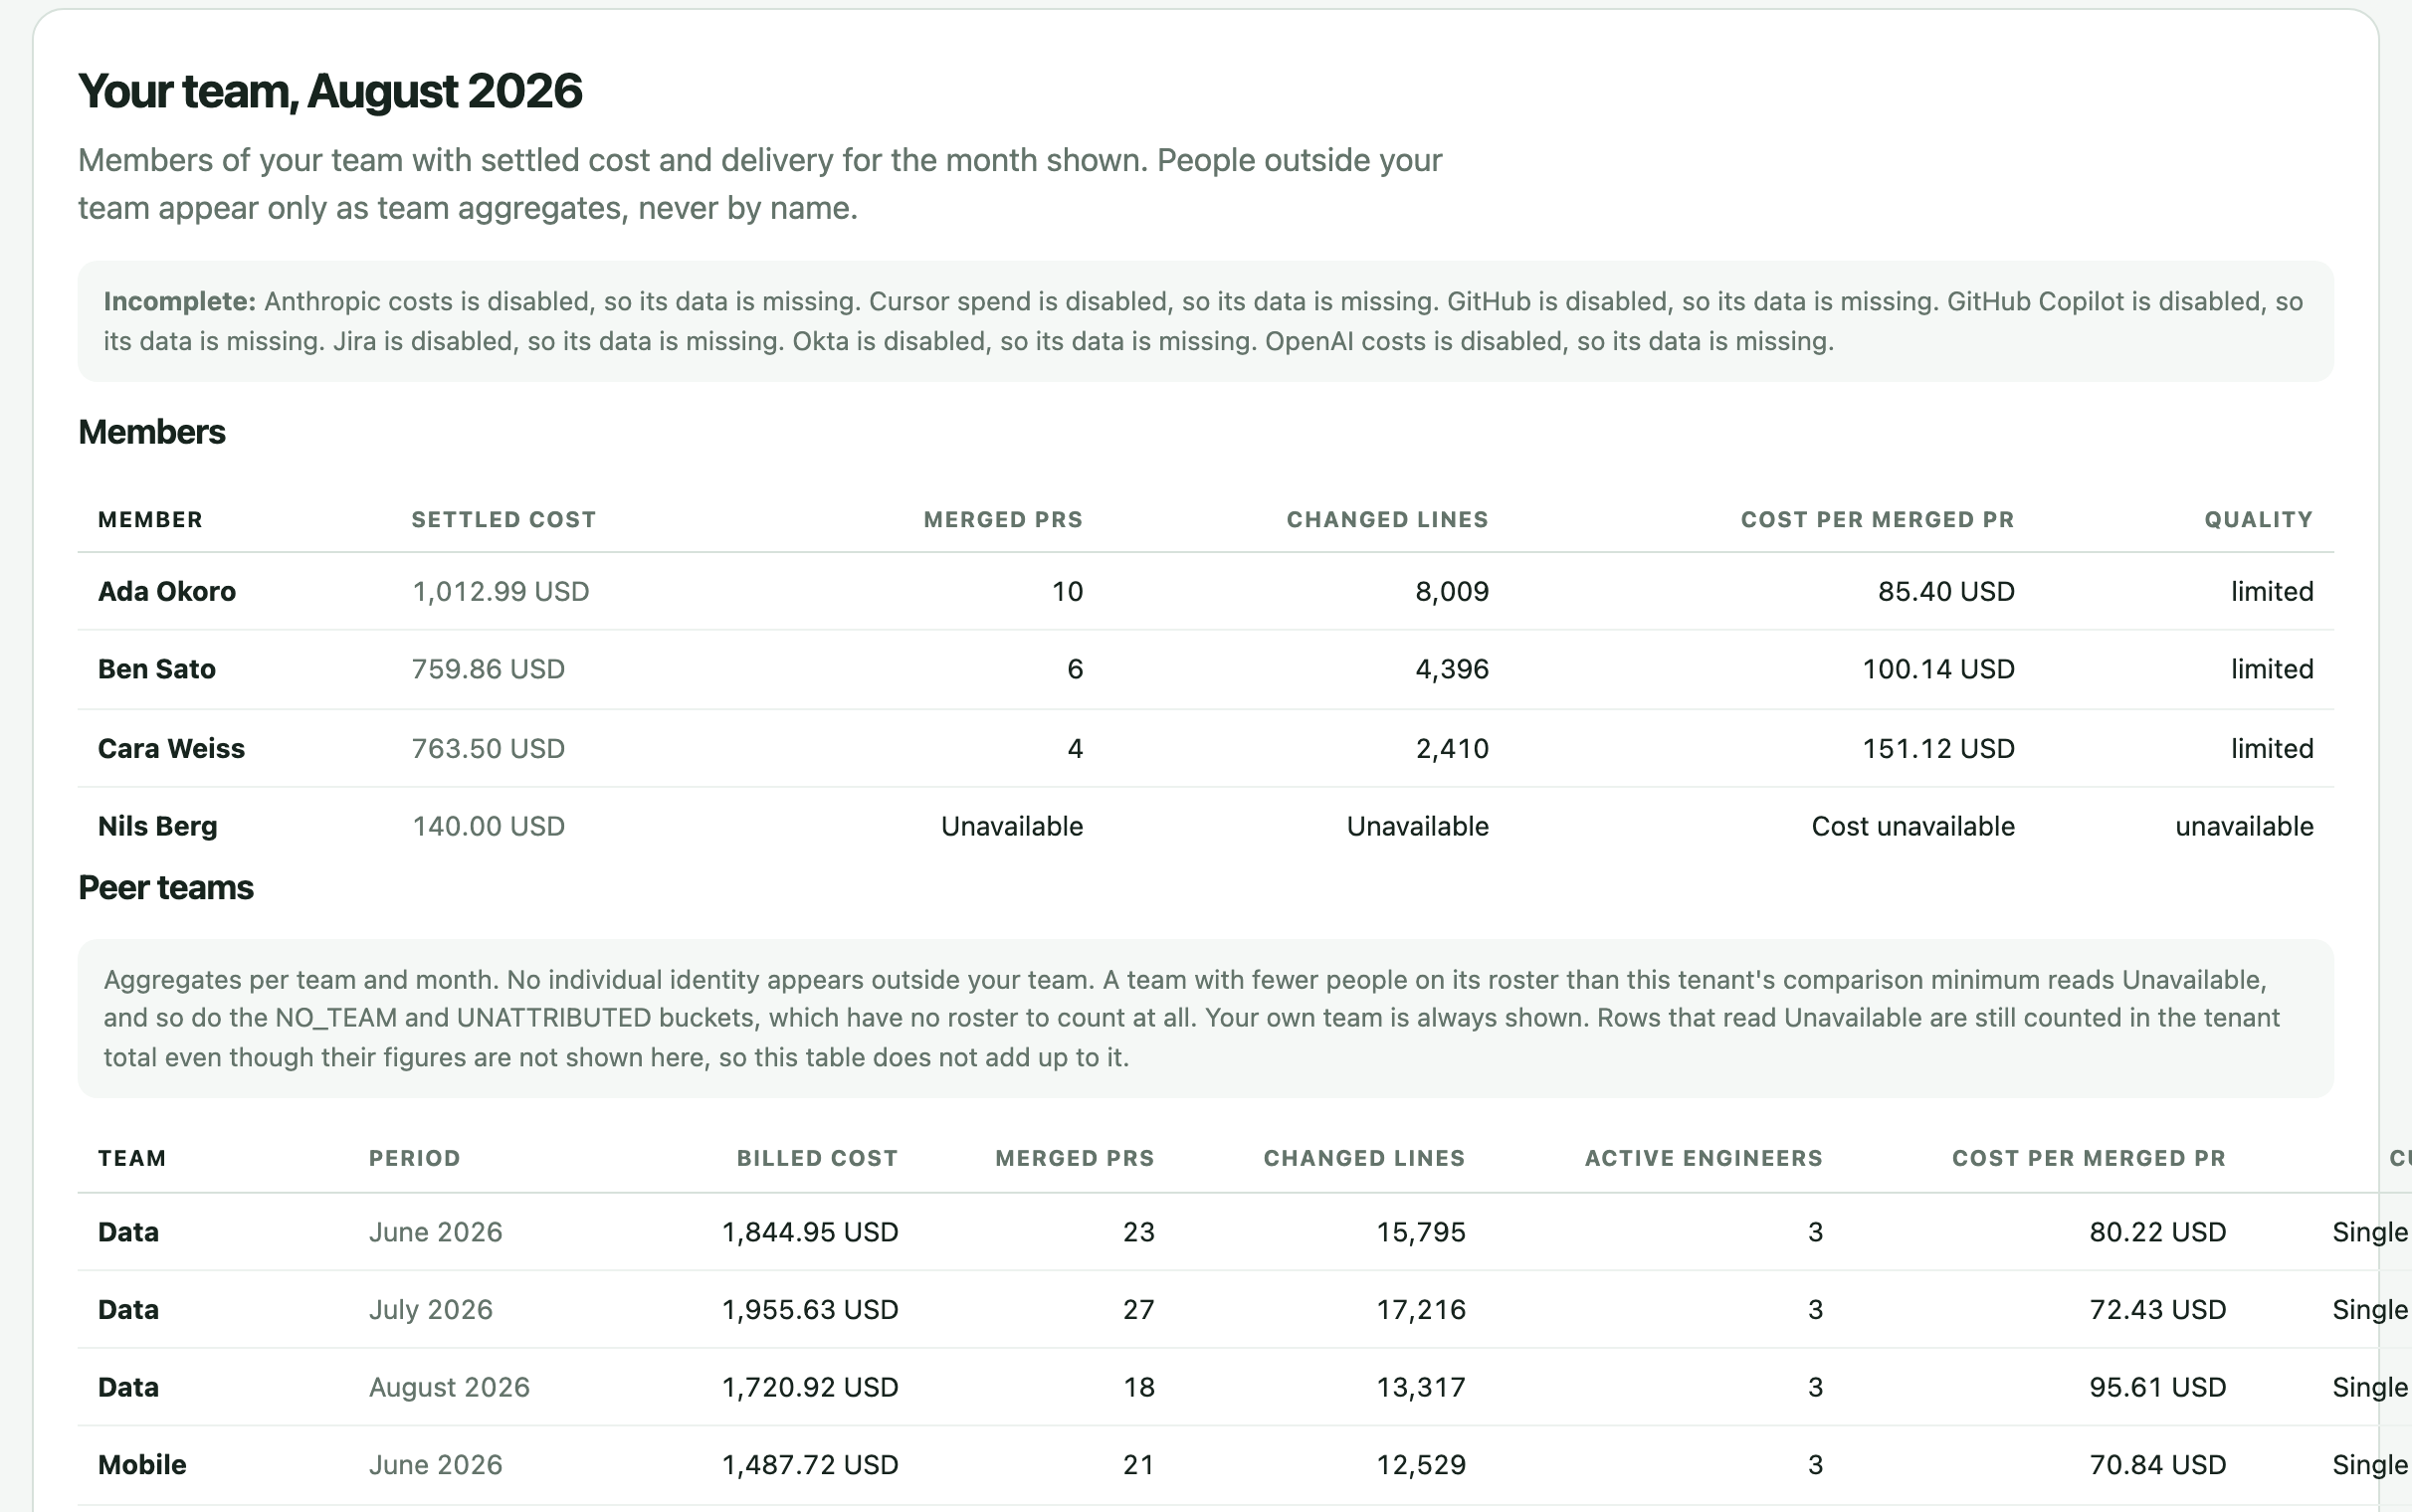
Assistants and agents, beside what got resolved.
Incidents, changes and requests already carry a person, a priority and a time to resolve. Set your AI spend beside them and see whether resolution got faster where the money went.
- AI spend per team against incidents and changes closed
- Time to resolve before and after adoption
- Runs inside your ServiceNow instance as a scoped app
- Incidents, changes, requests and catalog tasks read as work items
Illustrative data only. Differences between groups do not establish that AI caused the result.
Copilots and agents, beside pipeline and cases.
Opportunities and cases carry stage, amount and outcome. Join those records to team-level AI spend to explore cost per outcome, while keeping correlation separate from proof of impact.
- AI spend per team against opportunities advanced and cases closed
- Value per unit of spend where the record carries an amount
- Salesforce opportunities and cases, built and not yet live; HubSpot planned
| Team | AI spend | Outcome | Per $1,000 |
|---|---|---|---|
| Enterprise sales | $3,100 | 231 opportunities advanced | 75 |
| Mid-market sales | $2,200 | 181 opportunities advanced | 82 |
| Support, tier 1 | $2,410 | 468 cases closed | 194 |
| Support, tier 2 | $1,200 | 168 cases closed | 140 |
Illustrative data only. Output counts and pipeline amounts are not realized ROI.
A month you can post.
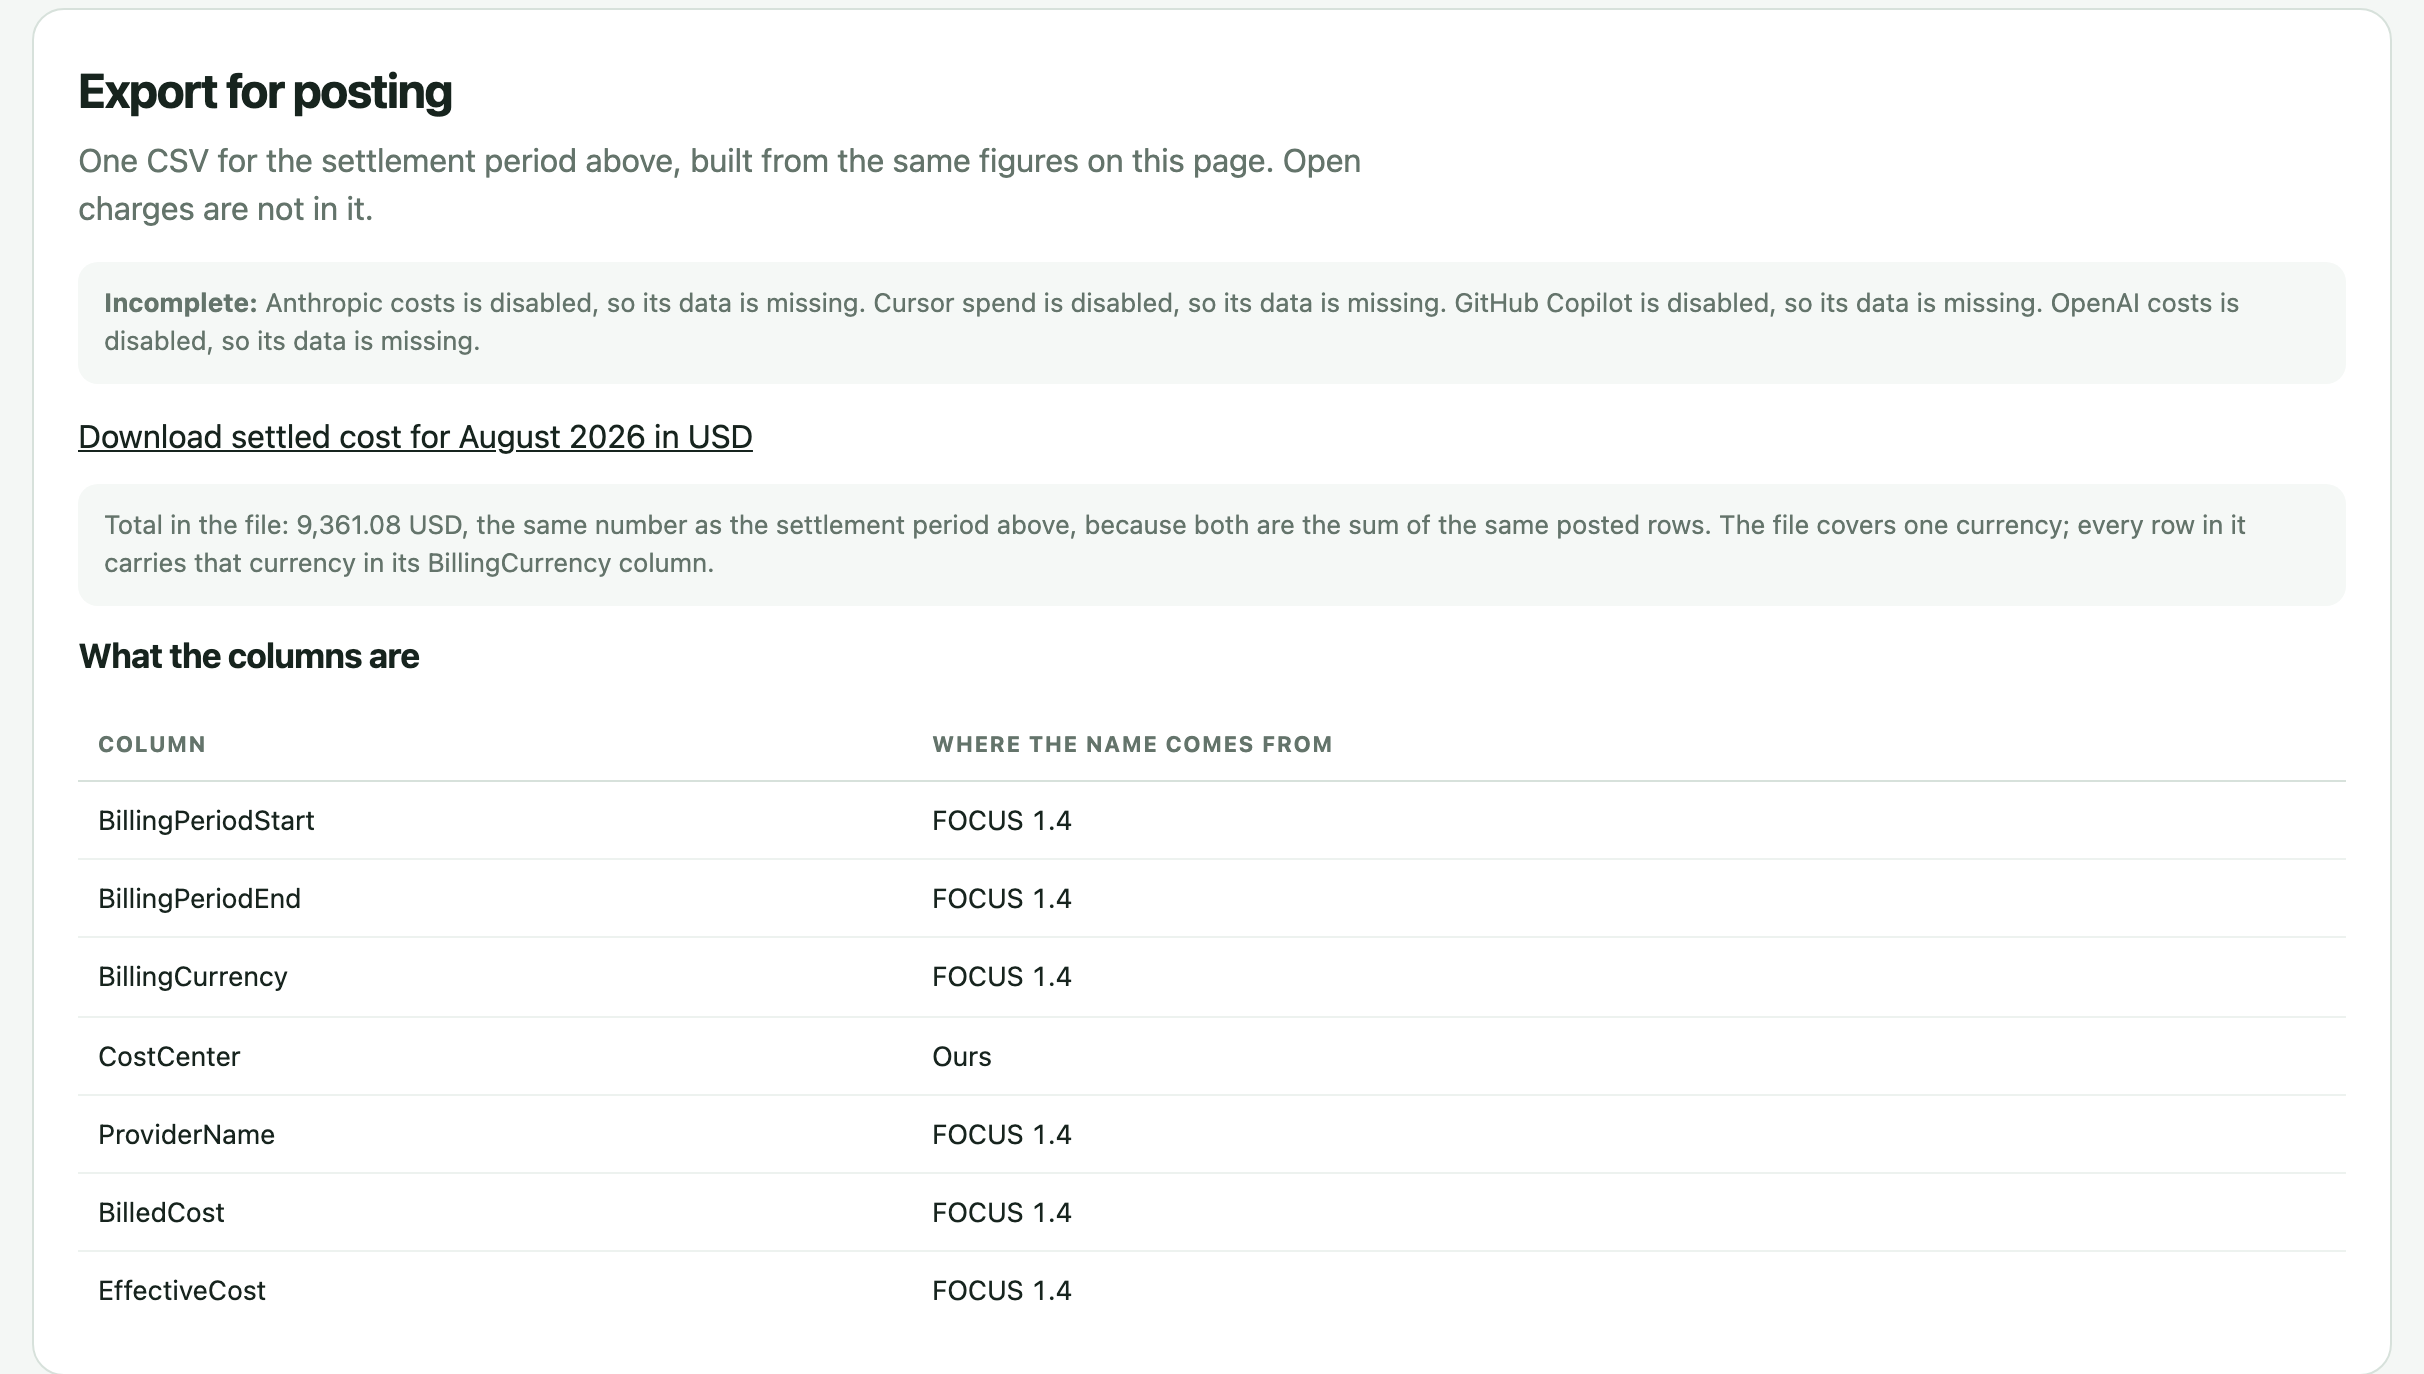
A settled month by cost centre, provider, commercial model and function, with open charges named and held back, and a chargeback file whose total is the page's total.
- No individual named anywhere in the finance view
- One currency per total, never a blend
- Contracts, commitments and the rate each charge was bought at
- FOCUS-aligned columns for the tools you already use
Your own numbers, live, and nobody else's business.
The desktop client shows your usage, limits and credits as they happen. It runs locally on your workstation. Public access is coming soon. See the desktop client.
- Live usage and plan limits in the menu bar
- Your sessions grouped by project and task
- Nobody sees you by name unless they run your team
Is the AI worth what it costs?
The FinOps Foundation's State of FinOps 2026 report describes the challenge of measuring AI value1.
Engineering leaders say the same from their side. DX asked 50 engineering budget holders, and 86% were unsure which tools gave the most benefit, while 40% lacked the data to make a return on investment case2.
Across more than 400 organizations tracked for 14 months, DX observed a median gain in pull request throughput of 7.76%3. That is an observed association, not proof of causation. Compare spend and output within the same team, period and work type before making a decision.
Seats, contracts and metered keys.
What you need first depends on how the spend is bought, not on how many people you have. A company can buy in more than one of these ways at once.
Seats and subscriptions
Cursor, Copilot and Claude seats: start with idle seats and plan fit.
Negotiated and committed
An annual commitment or a discount off list: start with declared commitments, drawdown and the rate basis of each charge.
Metered and pay as you go
API keys, on-demand plans and gateways: start with budgets, caps and the cap decision.
One number to find first.
What does your company spend on AI tools per employee each month?
For scale, Ramp's card and bill-pay data for June 2026 put the median company at $11.38 a month on AI for each employee, while the top 1% of companies spent $7.45K4. That spread is a question to ask yourself, not a line we draw: wherever your own figure lands, it tells you whether seats or budgets deserve your first hour.
The same chain, for any team whose work leaves a record.
Sales, support, operations and finance teams buy AI too, and their seats and keys arrive on the same bills. ai-cur is built to read that spend and land it on the people and teams who ran it.
What decides the rest is the work record. The join needs a unit of work with a person and a date on it: a pull request, an issue, and in the same way a ticket, a change or a job. Connectors for GitHub, Jira, GitLab and Linear, and for ServiceNow and Salesforce records, are built and have not yet run against a real account. ai-cur can also run inside ServiceNow and Databricks, where much of the other work is recorded. We will say so here when the join is proved on a running system.
There is no open, vendor-neutral standard for the return on AI outside engineering, and ai-cur makes no claim to one. It will show cost beside the work, and leave the verdict to you.
- 1FinOps Foundation, State of FinOps 2026, data.finops.org, read 8 August 2026.
- 2DX, engineering leaders on the 2026 AI tooling budget, getdx.com, read 8 August 2026.
- 3DX, AI coding assistant pricing, getdx.com, read 8 August 2026.
- 4Ramp, AI Index, June 2026, ramp.com/data, read 8 August 2026.
Your role, your view, one record.
Coming soon. Contact us to discuss your cost sources and work systems.